
News and Announcements
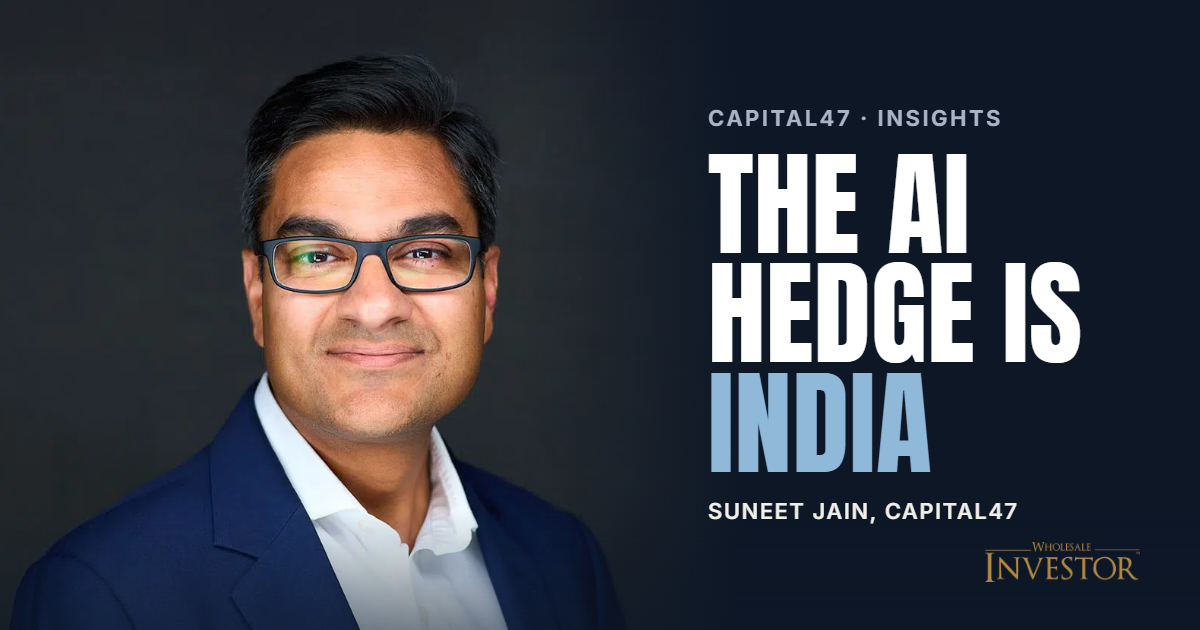
A$5 trillion market Australians can see but cannot easily buy
- Published October 30, 2026 12:00AM UTC
- Publisher Bella Battsengel
- Categories Company Updates, Executive Interviews
Every asset class now carries artificial intelligence exposure, including the ones built to be defensive. Capital47’s argument is that every portfolio should have a diversification strategy.
The problem with AI as a portfolio exposure is that it has stopped being a sector.
Planned global spending on artificial intelligence is expected to run to US$8 trillion by 2030, based on Capital47’s view. Roughly US$450 billion of debt had been raised against that build-out by September 2026, as companies issue bonds to fund infrastructure.
That last detail is the one that matters for allocation. AI is no longer something an investor owns in the equity sleeve and avoids elsewhere. It sits across asset classes, which means a portfolio can carry the same underlying risk three times while appearing diversified on a sector chart.
The risk Capital47 identifies is a valuation one. To support current pricing, companies need to annualise revenue at rates above their own history coupled with higher borrowing costs. That is a demanding requirement, and it is the same requirement across equity and credit.
So the question becomes what should an investor hold that does not depend on it.
Why the answer is a geography
Capital47’s case is that India supplies genuine non-correlation rather than the diluted version.
The argument rests on composition. An allocation to India brings sectors such as financial services, consumer discretionary, healthcare, industrials and energy, into a portfolio which is a materially different weighting to most of what competes for the same allocation.
The supporting number is the most specific claim in the firm’s material, and the most useful. Measured by the top two sector weights in regional benchmarks, India runs at roughly 42 per cent. Taiwan sits near 95 per cent. South Korea is near 82 per cent.
For an investor whose concern is concentration, that is the whole comparison. An emerging market allocation to Taiwan or Korea is substantially a technology allocation under another name. India is not.
Capital47 adds that India trades at multi-year discounts to emerging market peers on relative price to earnings and relative price to book, despite what it characterises as improving fundamentals. That claim is the firm’s own and is the sort of thing an allocator should check against current data rather than accept. Indian equities have traded at a premium to its Emerging Market peers on account of the country’s relatively stable corporate earnings outlook and broad-based market.
The growth record, and the forward number
The historical case is a scale case. World Bank data has India’s GDP rising from US$485 billion to US$4.1 trillion over the last 25 years, a compounded annual growth rate of roughly 8.9 per cent in nominal US dollar terms. Behind it sits a consumption-driven market.
The forward figure is the one worth putting beside it. India’s current inflation of 4.82 per cent sits alongside a real GDP forecast of around 7 per cent, underpinning a nominal GDP figure Capital47 puts at approximately 10.5 per cent. That is the firm’s read on the demand side of the equation.
Capital47 nominates six drivers behind it. The demographic dividend, a skilled workforce, financial inclusion, expansion of manufacturing, start-up funding and the build-out of infrastructure.
What is actually driving the growth
The manufacturing case is the most concrete of the five.
India’s Production Linked Incentive Scheme, introduced five years ago, now spans 14 sectors, and the clearest evidence of its effect is in electronics. Roughly one in four iPhones is now manufactured in India, a shift reported through 2026 as Apple moved production away from China.
Two structural inputs support that expansion. Electricity production costs of around US$0.08 per kilowatt hour, and India’s position as the third largest electricity producer globally.
Trade access has moved in parallel. Capital47 counts nine free trade agreements over five years, the largest being with the European Union and its 27 member states. The India-EU agreement was concluded in January 2026 after two decades of negotiation, with formal signature reported as expected later in the year, so its benefits are prospective rather than operating.
The firm’s argument is that this trade architecture lets India lift its share of global manufacturing gross value added from current levels near 3 per cent, with the profitability opportunity accruing to Indian corporates producing for both domestic and export demand.
On the demographic dividend, Capital47 points to a median age of 29.2 against a world average of 30.9, and labour force participation at 55.3 per cent against a world average of 61 per cent. The second figure is the more interesting one, because an economy growing while a large share of its working-age population sits outside the formal labour force has a productivity lever most developed markets do not.
Urbanisation carries a similar asymmetry. Around 36 per cent of the population lives in cities, while 58 per cent lives at what the firm describes as urban-like densities. The gap is where tier two infrastructure spending lands.
The research problem, and the structure built around it
India’s equity market is deep enough that selection is the binding constraint rather than access.
Capital47 counts around 5,000 securities on the National Stock Exchange, roughly 65 fund managers domiciled in India running about 650 equity-oriented funds, with combined assets under management near US$1.2 trillion.
“From investing myself, I am familiar with the deep research involved in assessing value companies to invest in, or Fund Managers and Funds to select from,” Suneet Jain said.
What follows that research is administration, and the firm’s co-founder Vipul describes it as the point where most offshore investors stop. Identifying a broker for direct equity. Know Your Client onboarding. Applying for a Permanent Account Number, the Indian equivalent of a tax file number. Opening and maintaining a local bank account, alongside other procedural requirements.
“By which time you are wondering, what is the payoff on my effort,” he said.
Capital47’s answer is a digital onboarding process conducted to Australian KYC standards, with monthly holding statements and performance reporting delivered through an investor dashboard.
“It is essentially a plug and play model,” Vipul said.
Suneet’s framing of what sits behind that wrapper is that India rewards active management, and that the fund provides diversification across large, mid and small capitalisation companies and multiple sectors without the investor having to conduct the underlying research.
Performance, and how to read it
The Capital47 India Fund delivered capital growth of 5.5 per cent from May to September 2026, after fees and after currency movement. The firm describes the period as a depressed market, with the Middle East conflict reignited and oil prices elevated.Performance of a geography during this period provides insights into the resilience of an economy.
The net basis is worth noting, because it is the harder number to report. A return quoted after fees and after the currency translation an Australian investor actually experiences is a more useful figure than a gross one, and most managers lead with the gross.
The caveats that remain are about duration rather than basis. Four months is a short window, the figure is not annualised and should not be, and no benchmark comparison is provided. Past performance is not an indicator of future performance.
The corporate earnings backdrop is the more durable data point. In the April to June quarter of 2026, NIFTY 500 companies delivered a 12 per cent year-on-year increase in profitability on a 19 per cent year-on-year revenue uplift.
Revenue growing faster than profit is worth noticing in either direction. It can indicate margin compression, or investment ahead of returns. It is not automatically the better of the two numbers.
The implication
The uncomfortable thing about a concentration problem is that it is invisible from inside the portfolio that has it.
An allocator holding technology equity, technology credit and an emerging markets sleeve weighted to Taiwan and Korea has made one bet three times. The sector chart will not say so.
Capital47’s proposition is that the correction for that is not a smaller technology position. It is an exposure whose return is driven by Indian domestic consumption, financial services and industrial build-out, which answers to a different set of questions entirely.
Whether India is uncorrelated to the thing most portfolios are now long is considerably harder to dispute.
DISCLAIMER
This material has been prepared by Capital47 Pty Ltd ABN 57 687 265 247 (‘Capital47’, ‘we’ or ‘us’). Capital47 is a corporate authorised representative (CAR 1318319) of FB Corp Limited (‘FB Corp’) (ABN 16 675 876 490) (AFSL 557810). The material is for general information only and is not an offer for the purchase or sale of any financial product or service. The material has been prepared for investors who qualify as wholesale clients under sections 761G of the Corporations Act or to any other person who is not required to be given a regulated disclosure document under the Corporations Act. The Company, the Licensee and any other person do not guarantee the return of capital or the payment of any income. The material is not intended to provide you with financial or tax advice and does not take into account your objectives, financial situation or needs. Although we believe that the material is correct, no warranty of accuracy, reliability or completeness is given, except for liability under statute which cannot be excluded. To the maximum extent possible, the Licensee, Capital47 or any other person do not accept any liability for any statement in this material.
Please note that past performance may not be indicative of future performance and that no guarantee of performance, the return of capital or a particular rate of return is given by the Licensee, Capital47 or any other person. This does not show the performance of the Capital47 India Fund but of underlying funds and benchmark indices.
The material may contain various opinions or financial objectives concerning the anticipated future performance of the Fund, which may or may not be realised or be accurate. These opinions or financial objectives are not guarantees of future performance and involve certain risks, uncertainties and assumptions that are difficult to predict. As a result, actual outcomes and results may differ materially from what is expressed or forecasted in these forward-looking statements. Any opinions, estimates or financial objectives expressed in the material are based on reasonable assumptions. These assumptions may not prove to be correct or appropriate. All proper enquiries have been made to ascertain or verify the foregoing, however Capital47 does not make representations or warranties as to the validity, certainty or completeness of any of the assumptions or the accuracy of the opinions, estimates, financial objectives or forecasts contained in the material. Capital47 will not update or revise forward- looking statements, or publish prospective financial information in the future, regardless of whether new information, future events or any other factors affect the information contained in the material.
Executive Interviews
A$5 trillion market Australians can see but cannot easily buy
Every asset class now carries artificial intelligence exposure, including the ones built to be defensive. Capital47’s argument is that every portfolio should have a diversification strategy. The problem with AI as a portfolio exposure is that it has stopped being a sector. Planned global spending on artificial intelligence is expected to run to US$8 trillion […]
The A$20.4 Million Inertia Trap: How Kepa Software Is Unlocking Value in Enterprise Capital Allocation
A government agency renewed the same maintenance decision nine years running, because auditing the original choice was deemed too expensive. When the portfolio was finally tested, A$20.4 million of low value spend was identified in a single year. Kepa Software’s capital governance platform was built to expose and eliminate precisely these boardroom blind spots. For […]
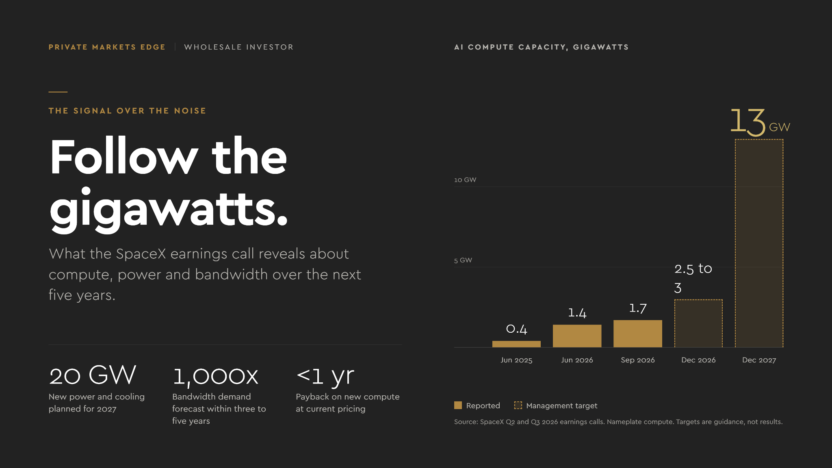
Forget the share price. SpaceX just published a map of the next five years.
Most coverage of SpaceX’s result focused on a 9.1% share price fall. That is noise. The signal is in the transcript: compute, power, bandwidth and demand over the next five years.
Backed By Leading Investment Groups and Family Offices